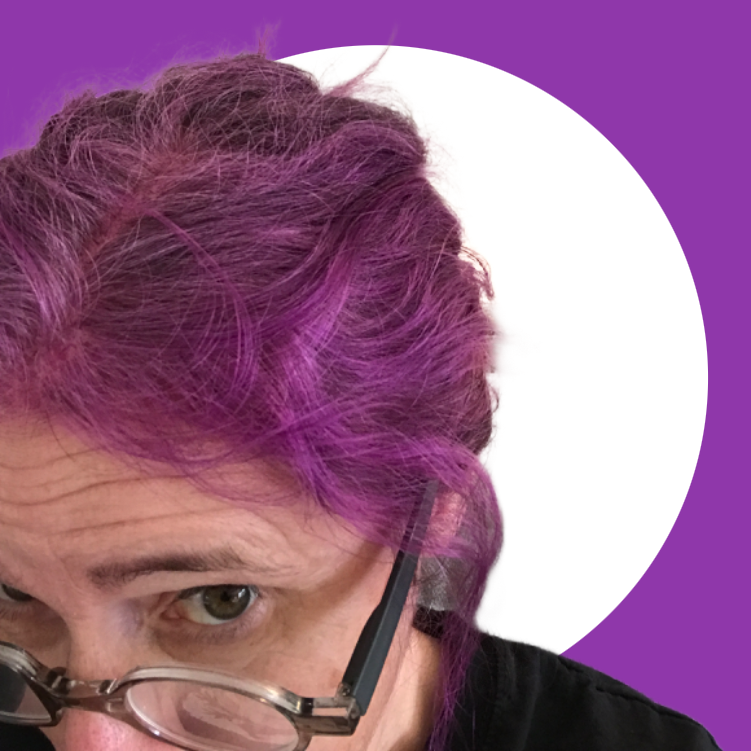
I’m Claire – I’m an artist/mathematician.
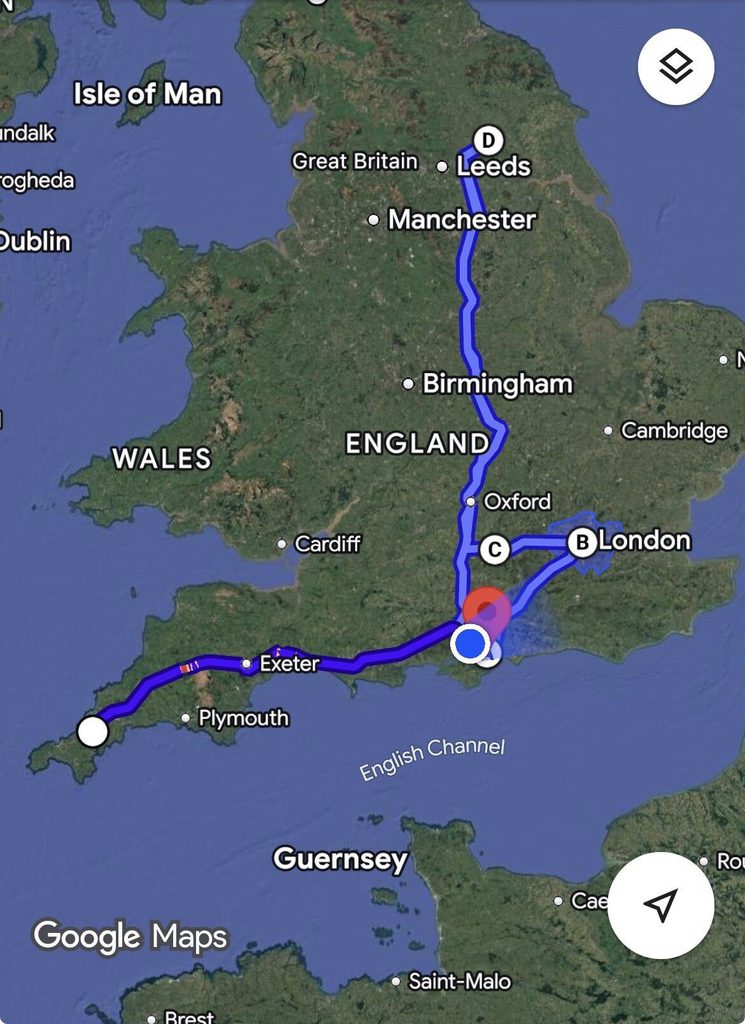
I grew up in Cornwall, where I learnt to slow down, stand back and look at the beauty in the world.
After a bit of a traumatic childhood, I became a goth/punk/hippy person, with some big and alternative plans.
I left Cornwall when I was about 20, to head off to Portsmouth and start my four year degree in Mathematics and it’s Applications. This included a year in industry, when I worked for MAFF, now DEFRA, in Horseferry Road, London. This was where I met my husband, Rich.
We lived in Reading for a few years, where I worked for Berkshire Health Authority, inputting data into their database.
We moved with work up to beautiful York, where I worked for North Yorkshire Health Authority, loading and validating finished consultant episode and waiting list data into our database and producing outputs.
A Census was about to happen in 2001, and Rich got asked to work on the Census Coverage Survey. I was pregnant, so we headed south (on a donkey?) for us all to get counted down in sunny Titchfield. And this is where we have stayed ever since! I nurtured our son for a few years and then joined the ONS to work on outputs for the 2021 Census.
I have since worked on using admin data to produce household statistics, forecasts of households estimates and now data visualisation of all of the difference data that the ONS produces.
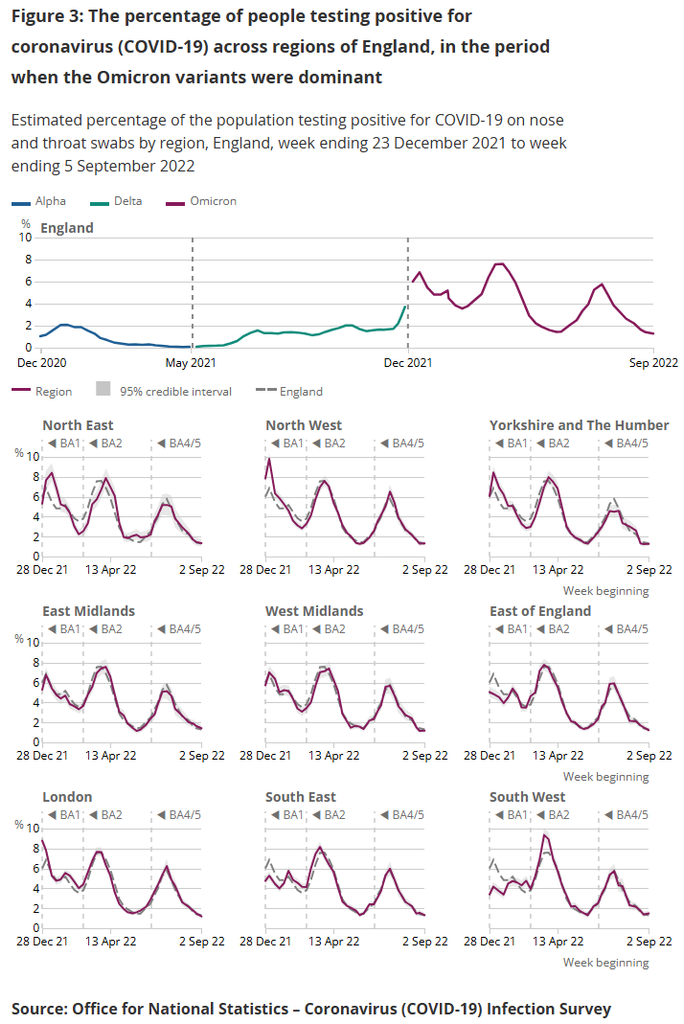
I produced the weekly charts for the Coronavirus Infection Survey from 2020 to 2023, providing Regional and sub-regional estimates of coronavirus (COVID-19) positivity over time, UK as a retrospective summary.
Simultaneously, I’ve have created a great number paintings, which celebrate nature, poems and lyrics. I’ve exhibited at the Titchfield Art and Craft Show many times and won an award their for best newcomer.


I also have an enormous passion for gardening and I’m documenting my garden in it’s own journal, which include locations and names of all the plants we have.


