I have made a lot of charts. Most have been published, some have been shared, and some have quietly disappeared into a folder with a name like “final_v7_REALLY_FINAL”. This blog is about two of the latter: the charts I loved, worked hard on, and never got to release into the wild.
They were not bad charts. At least, that is what I tell them when I visit the folder. They simply did not make it through publication, for different reasons. One was a bubble chart. The other was a spiral showing infection rates over time. Both taught me something useful about making data visible—and about letting a chart go, even when it has clearly made itself comfortable. I have learnt that I have a yearning for arcs in my graphs.
The bubble chart that burst
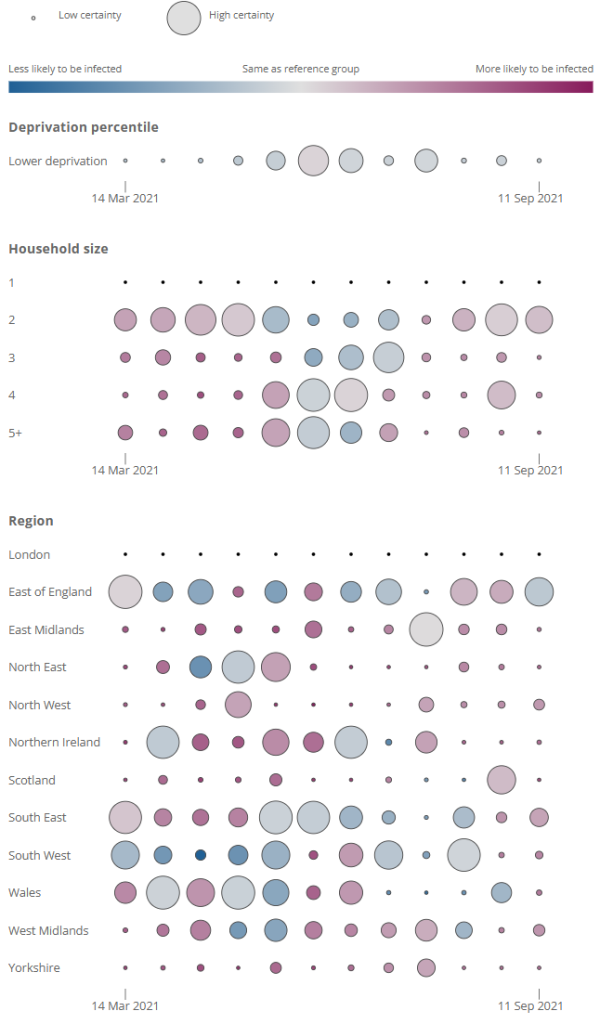
The first chart used circles of different sizes and colours to show infection rate data over time and the uncertainty around those estimates. A bubble chart can carry several variables at once: position tells you one thing, size another, and colour something else. It is a kind of visual multitasking—which, unlike my own multitasking, can occasionally work.
I liked it because it made the variation in the data feel immediate. The large circles demanded attention; the smaller ones gathered around them; colour separated the groups. It looked lively, almost as if the data had organised its own party and drawn up a seating plan. It reminded me of the 1970s maths books I completely devoured when I was about 10.
But a chart can be attractive without being easy to read. People are not especially good at comparing the areas of circles, particularly when those circles are close in size. Add colour and labels, and even the most carefully arranged party can leave the reader working out who belongs at which table. The chart was doing a lot of work, but it was also asking a lot of the reader. This is why the legend was so important—and, in the end, I couldn’t make a good enough one in the limited time I had available (coronavirus outputs had a quick turnaround and little respect for leisurely design). I still feel that the key messages stand out.
In the end, it was not published because I wasn’t happy with it. The data is out there, but only as a chart for each time point, using bars: dependable, comprehensible bars, showing off by being useful. Sometimes the chart you are most excited to show is the one that needs the most ruthless questioning. Once the pandemic was over, I had more time to refine the legend a little.
The spiral that went round in circles
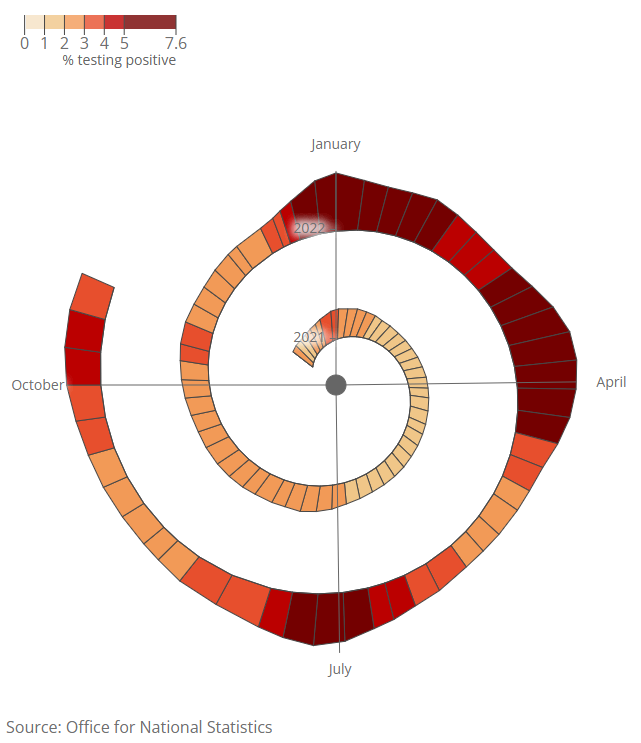
The second chart showed infection rates over time, with time arranged as a spiral beginning in the centre and moving outwards. In theory, this was a lovely fit. Infection rates rise and fall in waves; the spiral made those repeated patterns sit beside one another, rather than stretching them across an enormous horizontal axis and disappearing towards the horizon. Of course, I was looking for some sort of seasonal effect.
It was compact. It was striking. It had a beginning in the middle, which felt narratively satisfying. It also required readers to follow a curling path through time while interpreting infection rates and remembering which turn of the spiral they were on. A relaxing little cognitive obstacle course. It also bore a passing resemblance to Heidi Klum’s Halloween earthworm costume of 2022.
I wrote my own functions to place the polygons, taking into account leap years, because apparently the spiral was not already complicated enough.
Here’s one of them:
function get_degrees(mydate) { // calculate the degrees around the circle that the given date is - 0 is first one
  daysinthisyear=d3.timeDay.count(d3.timeParse("%d/%m/%Y")("01/01/"+get_year(mydate)), d3.timeParse("%d/%m/%Y")("31/12/"+get_year(mydate)));
  thisdays=day_in_year(mydate)
  return thisdays*(360/daysinthisyear)
}
The very feature that made the chart interesting also made it unfamiliar. A conventional line chart gives us a shared visual grammar: left to right, earlier to later, no map required. The spiral asked the reader to learn the route before taking in the message. That can be worthwhile when periodicity is the story. But when the main task is to understand the level and direction of infection rates, novelty can get between the reader and the data.
This one did not make it either. I still have a soft spot for it, although perhaps not enough to ask readers to bring a compass. Not all charts that go unpublished are failures; sometimes they are experiments that answer a different question from the one a publication needs.
What they left behind
Unpublished work can feel wasted, especially when you have spent hours adjusting labels by two pixels and developing opinions about shades of blue that no reasonable person should possess. But these charts were not wasted. They sharpened my sense of what a visualisation is for.
A chart is not there to prove that I can make it, however politely it may suggest otherwise. It is there to help someone see something. That may call for novelty, especially when the form reveals a pattern that a standard chart would hide. Or it may call for the visual equivalent of getting out of the way.
So these are my two that got away: one bubbled, one spiralled, and neither saw publication. I remain fond of them, while also accepting that love is not, by itself, a quality-assurance process.
Leave a Reply